Maritime and energy risk intelligence

One live picture of risk to the world's energy at sea

More than a thousand news items a day touch the oil that moves by sea. QuantShip reads them, grades them and puts them on one map with the chokepoints, the GPS interference, the naval movements and the crude flows, so you can see what changed, where, and how serious it is before your first call.

Why it matters

The problem is not a lack of news. It is knowing what the news adds up to.

The picture arrives in pieces

A strike on a pipeline, a mine in a strait and a refinery fire reach you as separate headlines from separate sources, hours apart. QuantShip puts them on one screen, graded by severity, each tied to the chokepoint or producer it touches.

One event, two readings

The same incident is a security event and a supply event. Most tools show one side. QuantShip shows the threat picture and the crude picture together, so the security team and the trading desk are looking at the same page.

Free data fails silently

A public feed can keep arriving on time after it has stopped being true. QuantShip checks its sources for that, and when a number stops being believable it is withheld and marked, not shown.

Who it's for

Three ways in

Trading desks and energy analysts

The dashboard

The question it answersIs anything threatening supply this morning, and is it getting worse?

One screen in place of a news terminal and six browser tabs: today's risk, the written briefing, the state of each chokepoint, and what the crude market is doing alongside it.

  • Know which chokepoint moved overnight, and why
  • See which buyers are lifting more or less than usual
  • Brief your desk from one page, with the sources attached
Ask about a seat

Quant and systematic research

The API

The question it answersDoes geopolitical risk add anything to my model, tested without hindsight?

Every dataset as it stood on any past date, with its revisions and how each record's first-seen time was established. We sell clean data and honest timestamps, not a ready-made signal.

  • As-of queries, so a back-test sees only what was knowable
  • Reconstructed and schedule-dated records are labelled as such
  • Free back-test trial before you commit
Ask for a back-test trial

Defence and government

The operational picture

The question it answersWhat does open-source reporting show at sea right now, and how sure are we?

Threat zones, GPS interference, naval press reporting and chokepoints on one globe you can brief from, with the sourcing visible and the gaps stated.

  • Built entirely on open sources, so it can be shared
  • Attribution marked as inference wherever it is inference
  • Pilot first, then an annual licence
Talk to us

The platform

What you get: four questions, answered from one place

A disruption at sea is a security event and a market event at once. QuantShip watches both sides and shows how they connect.

How much risk is there today, and why?

A single geopolitical risk score from 0 to 100, with the events driving it up and the events pulling it down. Escalation is checked against crude price movement, so a headline the market ignores does not move the score the way one it confirms does.

  • Written briefing on what changed, refreshed through the day
  • Top escalation and de-escalation drivers, by category
  • Every score has a breakdown you can open and read

Where is it happening?

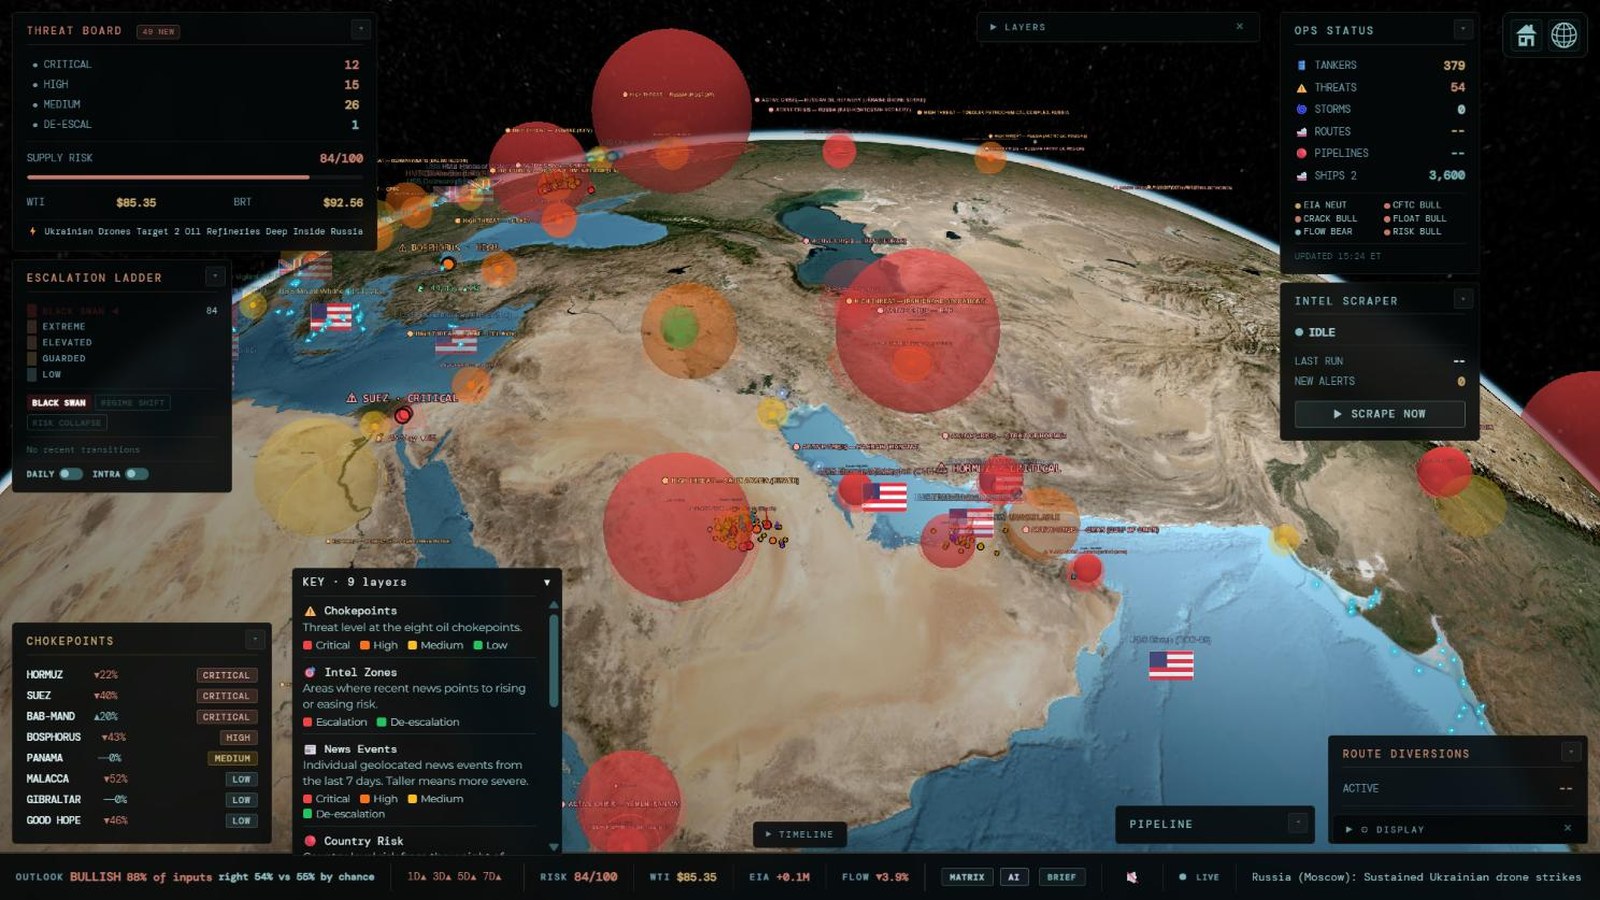
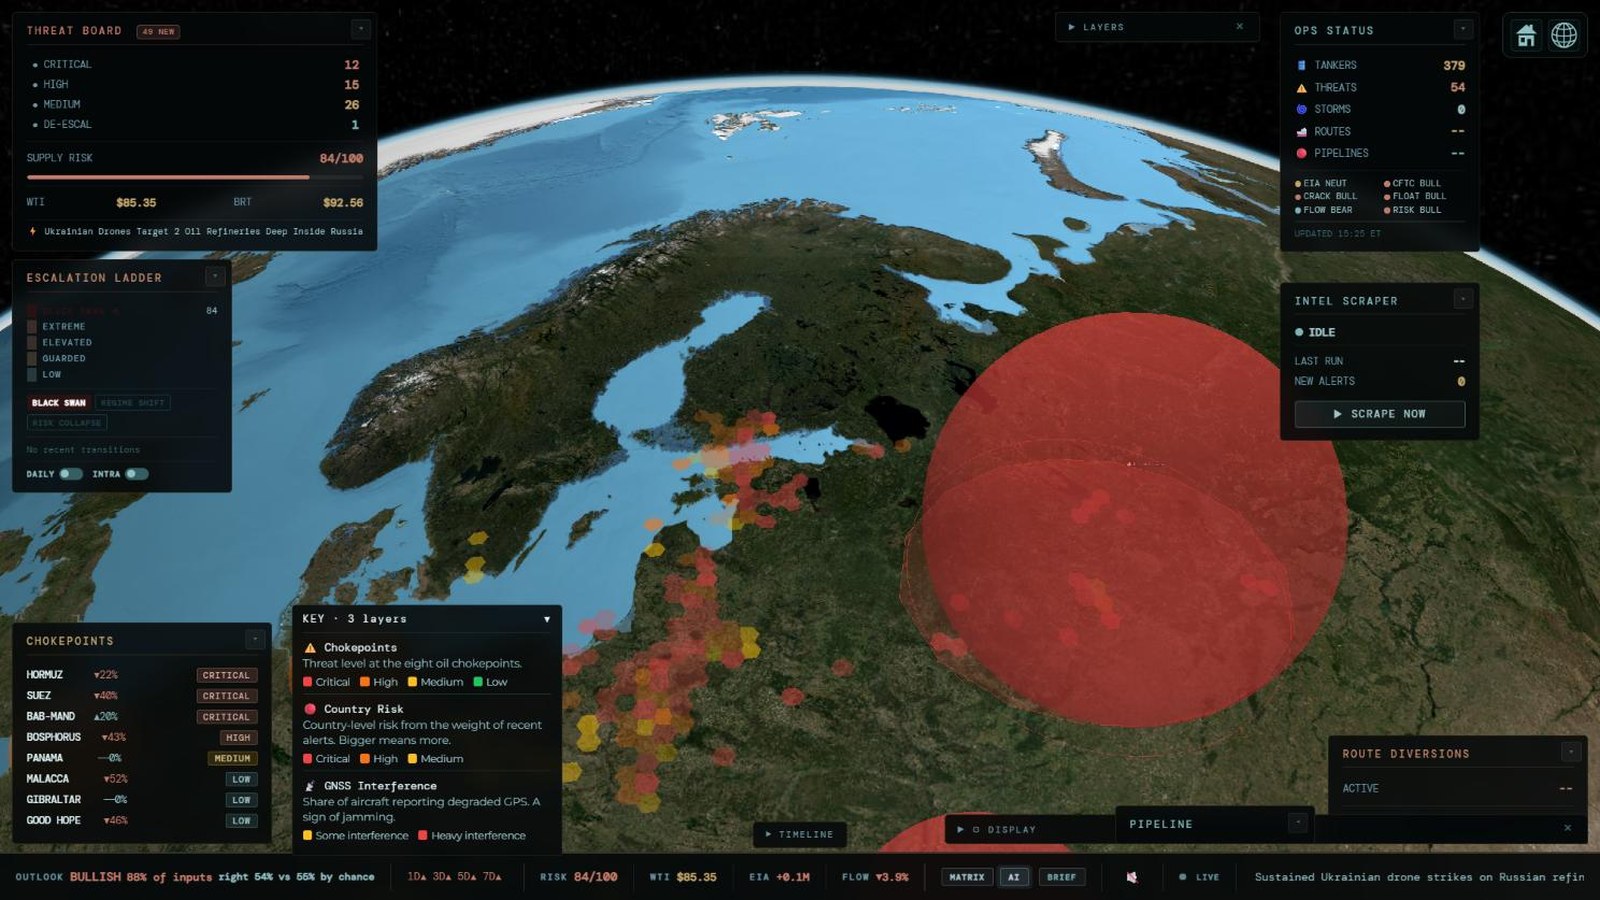
A 3D tactical globe with layers for threat zones, chokepoints, GPS interference, naval press reporting, pipelines, storms and satellite-detected oil spills. Chokepoints carry a threat level and a disruption probability; GPS interference is mapped into named zones.

  • GPS interference from aircraft navigation reports, by named zone
  • Naval movements from defence-ministry and navy press releases
  • Oil spills from satellite radar, fused across three sources

What is the oil actually doing?

Crude tanker fixtures, prices, crack spreads, inventories and positioning, read alongside the risk picture. This describes what the market is doing; it is not a price forecast, and we say so on the screens themselves. See which buyers are lifting more or less than their own recent norm, and how much crude is already fixed to arrive in each region in the weeks ahead.

  • Buyer behaviour against each charterer's own baseline
  • Forward arrivals by region and week
  • Crude, crack spread, inventory and positioning history

Can I trust it?

Open sources break quietly. A feed can keep returning data on time while the data itself has stopped being true. QuantShip checks its feeds for exactly that, and when a number stops being believable we withhold it and say so, on screen and in the API, instead of publishing it.

These figures are counted from the product each time this page loads. The API reference, with every route, is in the API documentation (sign-in required).


A real day

What QuantShip said on 17 November 2026

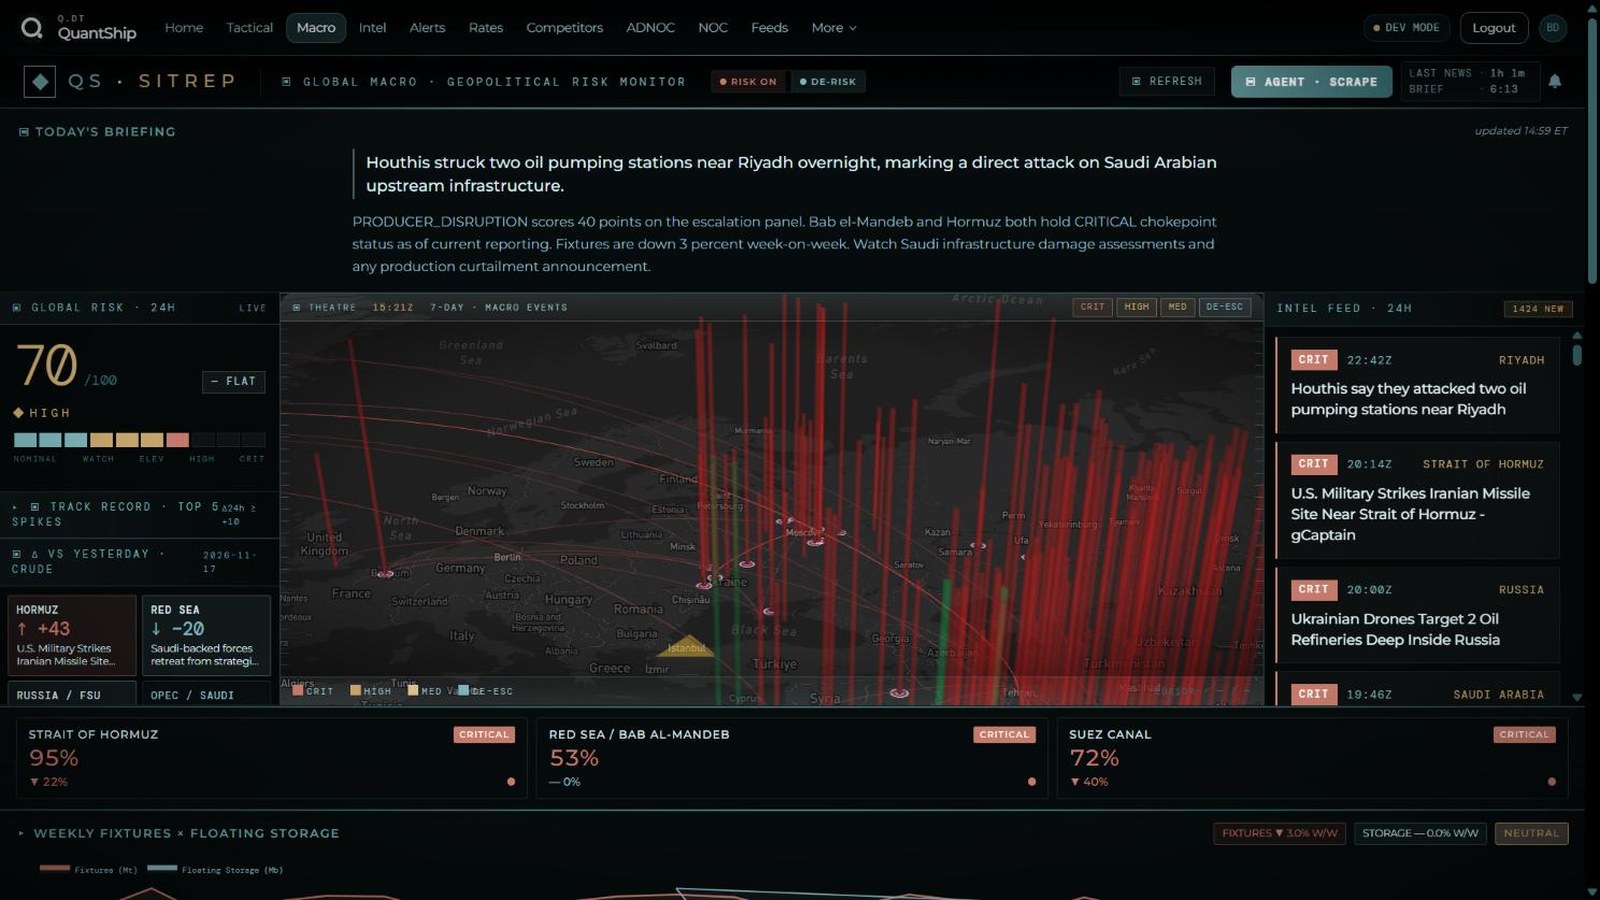
This is the product's own output from one afternoon, copied without editing. It is here so you can judge the writing and the detail for yourself.

Houthis struck two oil pumping stations near Riyadh overnight, marking a direct attack on Saudi Arabian upstream infrastructure.

PRODUCER_DISRUPTION scores 40 points on the escalation panel. Bab el-Mandeb and Hormuz both hold CRITICAL chokepoint status as of current reporting. Fixtures are down 3 percent week-on-week. Watch Saudi infrastructure damage assessments and any production curtailment announcement.

Today's briefing · Global Macro deck · updated 14:59 Eastern

Strait of Hormuz · disruption probability95%
Suez Canal · disruption probability72%
Red Sea / Bab al-Mandeb · disruption probability53%
  • Houthis say they attacked two oil pumping stations near Riyadh
  • U.S. military strikes Iranian missile site near Strait of Hormuz
  • Ukrainian drones target two oil refineries deep inside Russia

Chokepoint strip and intelligence feed · same screen, 15:21 UTC

The briefing is written by an AI analyst from that day's reporting, and the headlines are as published by their sources; neither is independently verified by us. The disruption probability is a model estimate built from threat level, recent events and traffic, not a forecast of closure.


Pricing

The dashboard is one price. The API is another.

Seats are for people who read the picture. The API is a data licence for teams who build on it, priced by how much history you need.

Dashboard

For people

$250

per seat, per month

  • Command deck, globe and intelligence feed
  • Fixture, rate and competitor analytics
  • Briefings and alerts
Ask about a seat

API Starter

For building

$500

per month

  • Current data across the catalogue
  • One year of history
  • Internal use by one team
Ask about API access

API Research

For back-testing

$2,500

per month

  • Full point-in-time history
  • As-of queries and revisions
  • Free back-test trial first
Ask about API access

Defence and enterprise

For organisations

Talk to us

pilot, then annual licence

  • Government and defence use
  • Many seats, or redistribution rights
  • Briefing support
Talk to us

Prices in US dollars, before any tax. API licences cover internal use; sharing data outside your organisation needs an enterprise agreement. There is no online checkout yet: tell us what you need and we set up your account and agree billing with you directly.

What you can useFree previewDashboardAPI
Tactical globe: threat zones, chokepoints, GPS interference, naval press, storms, oil spillsYesYes–
Global Macro deck: risk score, daily briefing, chokepoint statusYesYes–
Intelligence brief and alert history–Yes–
Fixture, rate and competitor analytics–Yes–
AI analyst: ask about any region or event–Yes–
Every dataset through the API––Yes
Point-in-time history, as-of queries and revisions––Research plan

What we don't claim

The limits, stated up front

You will find these out in your first week, so here they are now.

Vessel tracking is partial

Ship positions come from free public tracking feeds, which are thin in the Gulf and the Strait of Hormuz. If you need vessel-by-vessel tracking there, you need a specialist provider alongside us.

Hormuz transit counts are withheld

The public satellite-derived transit series for the Strait of Hormuz broke at its source in March 2026. We detect that and show no number, on the globe and in the API, until it recovers.

Point-in-time history is recent

Continuous capture began in October 2026. Earlier market history is dated from publication schedules or reconstructed from public sources, and every record says which.

Attribution is inference

When we name who is likely behind GPS interference, that is a judgement from location and context. Where we cannot defend a judgement, the zone is marked undetermined.

Open sources only

Everything comes from public reporting, public satellites and public data. We have no classified or proprietary collection, and naval movements are what navies chose to announce.

No uptime guarantee yet

We are a small team. The platform runs continuously and monitors its own feeds, but we do not offer a contractual service level today.

Talk to us

See it on a live day, or ask for access

Tell us what you are trying to do. A person reads every request.

  1. You send this form. It reaches us directly.
  2. We reply by email to arrange a demo on the live product, or to set up your access.
  3. Want to look first? Create an account and the free preview opens as soon as you confirm your email.

We use these details only to reply to you. See the privacy policy.